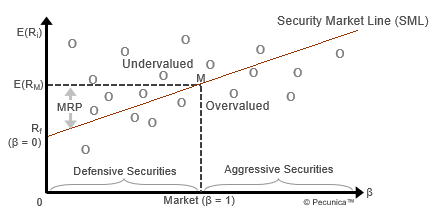
The CAPM enables the plotting of a security market line (SML), which illustrates that the expected return on an individual investment (E) is directly proportional to its relative correlated volatility (ß). Undervalued securities plot above the SML – the security’s expected return is greater than its required return, so it should be purchased. Where the SML intersects the y-axis, the value of the return on a risk-free investment and the systematic risk (ß) is zero, the point at which ß is 1.0 is the value of the expected rate of return for the entire market, and E(Ri) is the asset’s expected required return.
| The Security Market Line (SML) |
 Source:
|
The SML equation is, where E(Ri) is an expected return on an investment, E(RM) an expected return on market portfolio, βi systematic risk, RM market risk, and Rf the risk-free rate:
SML = E(Ri) = Rf + βi(E(RM) − Rf)
The SML represents the efficient frontier, where the returns on risk-free investments intersect the returns on the total market, it showing the combination of assets that offers the highest expected return for a defined level of risk. The optimal portfolio, which is the portfolio of assets that has the best possible expected level of return for its level of risk, benefits from a higher degree of diversification of assets allocated along the efficient frontier. Suboptimal portfolios, which lie below the efficient frontier and could achieve a higher return for the given level of risk, are less diversified than the optimal portfolio.
The CAPM implies that an investment fund indexed to the market will achieve the highest possible risk-adjusted return.