The yield curve is a graph plotting the observed yields to maturity of the most recently issued (“on-the-run”) benchmark debt securities in a market – generally central government issues, the maturities of the securities ranging from the shortest to the longest available. A rate on the yield curve is correct only for a given maturity and on the date of the curve, it changing across maturities and over time.
A yield curve is a benchmark, which serves as the basis of measurement for an interest rate, an index or peer group of bond prices or other values used for reference. Government bond and swap yield curves are the benchmark yield curves used for bonds.
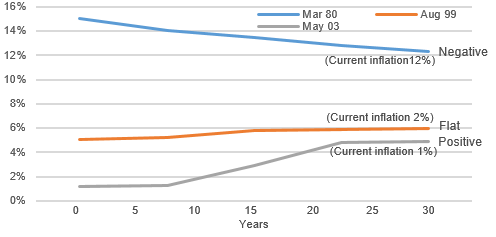
A yield curve takes one of three forms: positive, negative or flat. A positive yield curve results when the supply of funds is greater than the demand in the shorter maturities and/or the demand is greater than the supply in the longer maturities, causing interest rates to decrease for shorter maturities and increase for longer maturities. A negative yield curve illustrates that the demand for funds in the shorter maturities is greater than the supply of funds and/or the supply of funds in the longer maturities is greater than the demand, causing interest rates to increase for shorter maturities and decrease in longer maturities. If yields are about the same across all maturities, a flat yield curve occurs.
| US Treasury Yield Curve at Different Points in Times |
 Source:
|
Yield curve tend to be positive, not flat, because the market requires a premium for lending for longer maturities as compensation for increased credit risk, liquidity risk and the expectation of inflation over a longer horizon. The shape of the yield curve changes over time as the preferences of investors’ and borrowers’ change.